


The quickest reliable way to track QR code scans is to use a dynamic redirect or a decorated URL so every scan becomes a logged event you can see in GA4. Add UTM parameters, shorten the link before you generate the code, test the printed version across devices, and keep the data aggregate rather than identity-level to stay privacy-safe.
TL;DR:
- Dynamic QR codes are essential for tracking scans because they redirect through a URL that logs location, device, time, and source data.
- Using UTM parameters and URL shorteners improves data reliability, while platform choice affects control and ease of updates post-printing.
- Proper setup in GA4 requires verifying UTM parameters are present and functioning; otherwise, scans default to direct traffic, losing attribution.
- Accurate measurement depends on pairing scan data with downstream actions like sales or sign-ups, not relying solely on raw scan counts.
- Privacy compliance involves collecting only aggregate, non-identifiable data and being transparent about how scan information is used.
Table of Contents
- Why dynamic QR codes are the only type you can actually track
- The metrics worth watching on a QR campaign
- Making QR traffic visible in analytics: UTMs, shorteners and platforms
- Setting up GA4 to actually capture your scans
- Testing and quality checks before you print anything
- Turning scans into real attribution, not just a count
- Keeping QR tracking privacy-compliant
- Where QR scan data earns its keep
- What scan data actually tells you about your campaign
- How EcoCard keeps QR links and card analytics under one roof
- FAQ
- Sources
Why dynamic QR codes are the only type you can actually track
A static QR code encodes a fixed destination directly into its pattern. Once printed, it can’t be changed and it generates no scan data at all: it simply opens a link. A dynamic QR code instead points to a short redirect URL that forwards the scanner to your real destination, and that redirect step is what creates a loggable event.
According to Bitly’s analysis of QR tracking, the redirect layer records scan time, approximate location, device type and referrer, and lets you change the destination after the code has already been printed. That second part matters for anyone who has ever sent a flyer to print with the wrong landing page.
What a scan event typically captures:
- Timestamp: when the scan happened, useful for spotting peak hours
- Approximate location: usually city or region level, not a precise address
- Device and OS: whether the scan came from iOS, Android or a desktop camera app
- Referrer or source code: which specific printed asset or placement triggered the scan
None of this identifies the person scanning. Location is coarse, repeat scans from the same person look identical to two different people, and there’s no automatic capture of names, emails or other personal details unless your landing page separately asks for them.
The metrics worth watching on a QR campaign
Total scans tell you reach. Unique scans tell you how many distinct devices actually interacted with the code, which matters more if you’re judging genuine audience size rather than repeat curiosity from the same shopper walking past a poster twice.
Scan rate by placement is the number that should drive decisions: comparing scans per asset across different shelf positions, posters or event signage shows you which physical location earns attention. Time-of-day patterns reveal when your audience is actually engaging, which helps with staffing, social posting schedules or even when to swap creative. Device and OS splits matter because a landing page that loads slowly on an older Android browser will quietly lose you conversions no dashboard flags directly.
Scan trends by time and location work best as an early signal for reallocating resources, according to Bitly’s guidance on QR analytics, rather than as a standalone measure of success.
- Total vs unique scans: overall reach versus distinct engaged devices
- Scan rate by placement: which physical locations or assets perform
- Time-of-day pattern: when your audience engages
- Device/OS split: whether your landing experience matches how people actually scan
- Downstream conversions: sign-ups, purchases or bookings that follow the scan
Making QR traffic visible in analytics: UTMs, shorteners and platforms
Without preparation, QR-driven sessions tend to show up in analytics as plain “direct” traffic, indistinguishable from someone typing your URL from memory. Fixing that takes a few deliberate steps.
- Decorate your destination URL with
utm_source,utm_mediumandutm_campaignbefore you do anything else, for exampleutm_source=poster&utm_medium=qr&utm_campaign=spring_sale. - Shorten the decorated URL. A long UTM string makes the underlying QR code denser, and Analytics Mania’s walkthrough on GA4 tracking notes that fewer encoded modules scan more reliably from a distance or in poor lighting.
- Generate the QR code from the short link, not the long one, so the printed pattern stays simple.
- Choose your platform. A DIY shortener gives you full control over naming and destinations; a dynamic QR platform adds per-code dashboards and the ability to edit where a code points after printing, which suits campaigns with many placements to manage.
The trade-off is control versus convenience: DIY keeps everything in your own analytics stack, while a managed platform saves setup time but ties you to its domain and reporting structure.
Pro Tip: Agree on a UTM naming convention before launch, lowercase, underscores, consistent campaign names, so six months of QR reports don’t turn into a spreadsheet of near-duplicate labels.
Setting up GA4 to actually capture your scans
Before anything else, confirm your landing pages carry a working GA4 tag. Without it, none of the UTM work matters.
GA4 reads utm_source, utm_medium and utm_campaign automatically from the URL, no extra configuration needed, provided those parameters are present when the page loads. For a QR campaign, sensible values look like utm_source=storefront, utm_medium=qr, utm_campaign=autumn_launch.
To confirm it’s working:
- Scan the printed code yourself on a mobile device
- Open GA4’s Realtime report and watch for the session to appear within a minute or two
- Check that the session’s source, medium and campaign match what you set, not “(direct) / (none)”
- Once live, use the Traffic acquisition report with a secondary dimension of session campaign to break QR-driven sessions out from everything else
If a test scan shows up as direct traffic, the most common cause is a missing or mistyped UTM parameter on the destination URL, not a GA4 configuration problem.
Testing and quality checks before you print anything
A QR code that looks fine on screen can fail completely on a poster. Shortening the destination URL first keeps the printed pattern simpler and easier to scan from a few metres away, as noted in Analytics Mania’s testing notes.
- Minimum size: roughly 2cm square for close-up materials, larger for posters viewed from distance
- Contrast: dark code on a light background, avoid printing over busy imagery
- Quiet zone: leave clear white space around the code so scanners can find its edges
- Placement height: test at the eye level and distance people will actually stand
Test the final printed proof, not a screen preview, across a couple of phone models and in both bright and dim lighting. Keep a simple spreadsheet mapping each QR code to its placement, creative version and UTM string so you can trace any scan spike back to a specific asset later.
Pro Tip: Print one test sheet and walk it around the actual venue or shelf before the full run goes to print, screen previews lie about real-world contrast and glare.

Turning scans into real attribution, not just a count
Raw scan numbers tell you about attention, not outcomes. To connect a scan to an actual result, point different placements to unique landing pages, or attach a placement-specific promo code so a sale can be traced back to the poster, shelf talker or flyer that triggered it.
Where possible, match scan timestamps against sales or registration logs to see whether a cluster of scans around 6pm on a Saturday actually produced bookings or just curious browsing.
- Use unique landing pages or codes per placement to separate attribution cleanly
- Cross-reference timestamps with sales or sign-up logs rather than assuming correlation
- Treat scans as a reach signal, pairing them with downstream events like purchases or form completions to judge real intent
- Avoid the common mistake of reporting scan counts as conversions when no follow-up action was actually tracked
Keeping QR tracking privacy-compliant
Scan metadata is generally aggregate, time, device type, rough location, rather than identifying. That said, collection still needs to be necessary and proportionate under the Privacy Act 2020. The Office of the Privacy Commissioner’s guidance on biometric and automated processing makes clear that identity-level or biometric data collection carries specific obligations that standard QR redirects should never trigger.
- Stick to aggregate data: scan time, device and rough location, never biometric or identity data via the redirect itself
- Check advanced use cases: if a campaign moves toward profiling individual scanners, consult the Privacy Commissioner’s guidance first
- Be upfront in your privacy notice whenever a scan interaction feeds into further profiling or follow-up contact
Where QR scan data earns its keep
In retail, comparing scan rates across shelf positions or store entrances shows which spot actually earns attention, so you can move underperforming displays rather than guessing. At events, time-stamped scans reveal when session traffic peaks, useful for timing follow-up emails or staffing a booth. On packaging, dynamic redirects let you A/B test two different offers or calls to action without reprinting a single box.
- Retail: reallocate display space toward the highest-scanning locations
- Events: use scan timing to plan follow-up communications
- Packaging: test competing offers through the same code via editable redirects
- Iteration: review time, location and device splits regularly and confirm any hypothesis with a small follow-up test before committing budget
What scan data actually tells you about your campaign
Scan counts are directional, not definitive. A spike means something changed; it doesn’t tell you whether that something was good. Pair every scan trend with a downstream conversion event before touching budget allocation.
Check results daily in the first week of a campaign, then settle into a weekly rhythm. Act on patterns that repeat, not on a single unusual day. Centralised link and QR management, which is where a platform like EcoCard fits for teams juggling many codes, makes that kind of ongoing review far less tedious.
— Chris
How EcoCard keeps QR links and card analytics under one roof
Running QR campaigns across a team usually means someone’s personal shortener account, a shared spreadsheet of links nobody fully trusts, and codes that can’t be updated once printed. EcoCard’s features centralise link and QR sharing for digital business cards, so a destination can be updated live without reprinting anything, and usage analytics on card scans sit in one dashboard instead of scattered across tools.
- Centralised control: one place to manage links, QR codes and branding across a whole team
- Live updates: change a destination or detail without touching a printed code
- Built-in analytics: see card usage without stitching together separate tracking tools
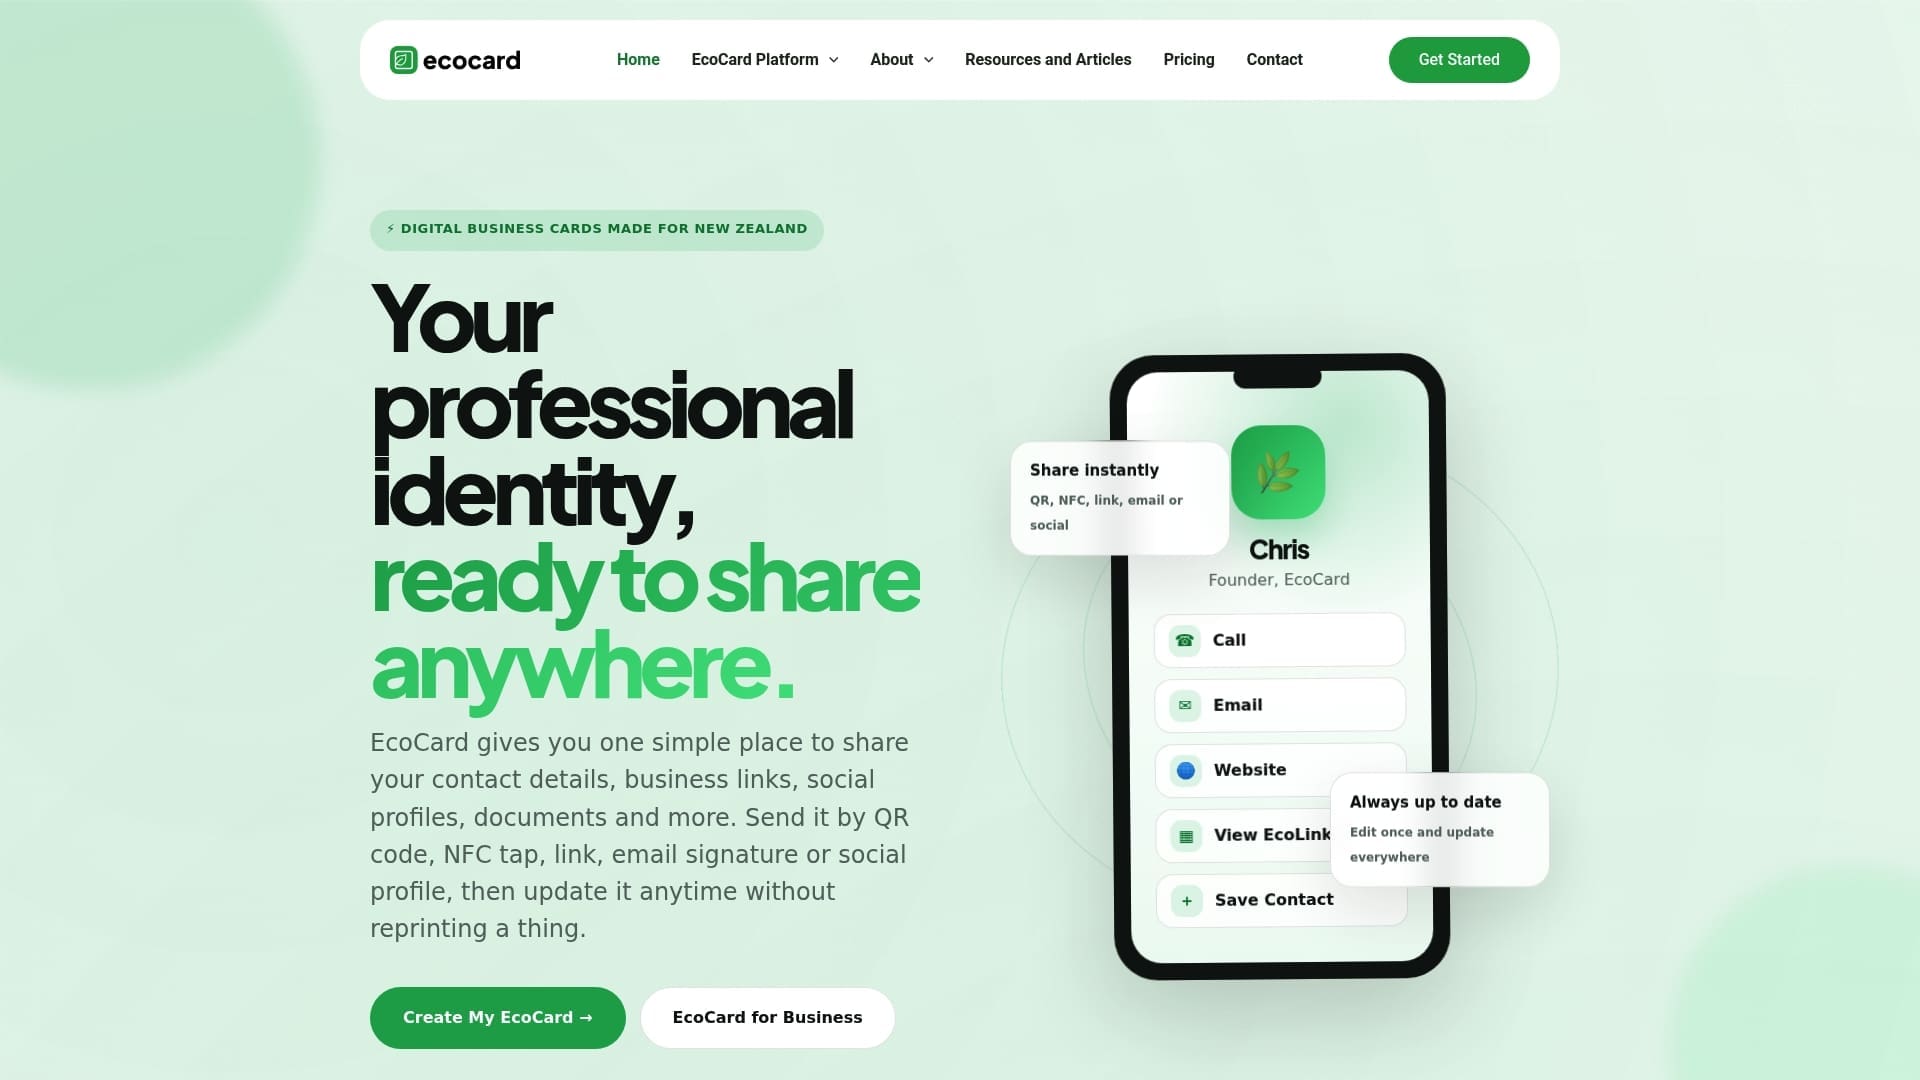
DIY UTM and shortener setups work well for a single campaign or a solo marketer. Teams managing cards and QR sharing across multiple people tend to outgrow that setup fast. Check EcoCard’s pricing to see which plan fits your team.
FAQ
What’s the difference between static and dynamic QR codes for tracking?
A static QR code has a fixed destination baked into the pattern and generates no scan data. A dynamic QR code routes through a redirect link, which is what allows scan time, device and location to be logged.
Does GA4 track QR code scans automatically?
GA4 only recognises QR-driven sessions when the destination URL carries UTM parameters like utm_source and utm_medium; without them, scans usually appear as direct traffic. Setting these up before generating the QR code, as described in Analytics Mania’s GA4 guide, is what makes the traffic visible.
What data does a QR scan actually collect?
A typical scan event logs the time, an approximate location, device type and the referring source, according to Bitly’s breakdown of QR tracking. It does not automatically capture names, emails or other identifying details.
Is QR code scan tracking compliant with privacy rules?
Aggregated scan metadata is generally fine, but collection still needs to be necessary and proportionate, and identity-level or biometric processing carries extra obligations under guidance from the Office of the Privacy Commissioner. Avoid collecting anything beyond aggregate metadata unless your privacy notice clearly covers it.
How much does EcoCard cost for managing QR links across a team?
EcoCard’s Individual plan starts at $9.99 NZD per month, with Business at $49.99 NZD per month and Teams at $99.99 NZD per month for centrally managed cards and link sharing, as listed on EcoCard’s pricing page. Enterprise pricing is available on request.
Sources
- How does QR code tracking impact marketing analytics? (Bitly)
- How to track QR codes with Google Analytics 4 (Analytics Mania)
- Biometrics processing privacy code overview (Office of the Privacy Commissioner NZ)
Recommended
This article was produced with AI assistance and reviewed for accuracy. It is provided for general information only and is not professional advice.

